How do you buy $6.15 for $3.86: a methodical balance sheet breakdown
One of the things that helped me as an investor is books, and like I’ve already told you, reading is a dialogue.
So I decided to use the time between running to the shelter and taking care of the kids, and read one of the most foundational books out there. But alongside it, I’d read a real company’s financial report.
The book is Financial Intelligence1, and I am going to focus on Part 3, which covers how to read a balance sheet2.
The book teaches non-accountants how to read financial statements.
One of its core ideas: the numbers in financial reports aren’t “objective truth” - they’re the product of assumptions, estimates, and biases. If you know how to spot them, you get to the real numbers and build a knowledge edge over everyone else. With that promise, let’s get started.
We’re going to focus on SmartSand3, which filed its annual report on 02/24/2026.
The company mines, processes, and delivers specialized sand (“proppant”) directly to well sites in the oil and gas industry4.
Why do I care? Because every data center being built for AI needs energy. More energy - more drilling. More drilling - more sand.
Financial statements are supposed to answer three questions:
- What do you own?
- What do you owe?
- How much money did you make5?
Today, we’re only focusing on questions one and two, which the balance sheet answers67. We’ll break it down line by line, keeping in mind that everything needs to balance according to the basic equation:
Assets = Liabilities + Shareholders’ Equity
In our case, for fiscal year 2025:
- Assets = 340,014
- Liabilities = 100,317
- Shareholders’ Equity = 239,697
What do you own?
Current assets8
Cash and Cash Equivalents - $22.5M vs. $1.5M last year A 14.5x jump in cash. That’s the first number that jumps off the page, and the immediate question is - where did all the money come from?
Accounts Receivable - $30.5M vs. $41M last year A $10.5M drop in the money customers owe them. That explains part of the big cash number we just saw.
But wait - if $10.5M moved from Accounts Receivable to cash, where did the rest of the jump come from?
$22.5M (cash today) minus $1.5M (cash last year) = a $21M jump, of which only $10.5M is explained by customer collections. That leaves $12M we still can’t account for.
And another question to keep in the back of our minds: the drop in Accounts Receivable could be a good sign (collecting faster) or a less good sign (fewer new orders).
When I went to the footnotes, I found that the company recorded zero allowance for bad debts - meaning they’re confident they’ll collect from everyone. That raises an eyebrow when you discover that 4 customers make up 57% of receivables.
Unbilled Receivables - $0 vs. $5.3M last year Last year, they had $5.3M of work performed but not yet invoiced. This year - zero. That means the real comparison basis for Accounts Receivable last year isn’t $41M but $46.3M - and that explains another chunk of the cash jump.
Inventory - $31M vs. $25M last year A 24% increase in inventory. When I saw that, I jumped to the footnotes to understand what exactly grew - and found two reassuring points: the company checked whether the market value of the sand dropped below its cost - it didn’t. They checked whether any sand was heading for the scrap pile - it wasn’t. Inventory grew because they’re working more, not because something is stuck9.
Prepaid Expenses - $4M vs. $2.6M last year A small increase. Probably insurance, licenses, or rent paid in advance. Not interesting.
Interim summary - current assets
Total current assets: $88M - up 16% from last year. The company’s total market cap is $174M. That means almost half the market cap is tied up in assets you can turn into cash within a year. That’s a number that gets your attention.
Long-term assets
Property, Plant, and Equipment - $223M vs. $237M last year The heaviest line on the balance sheet - down $13M. Why? I went to the footnotes10.
They bought equipment, not mines. They have 3 active mines, one idled mine, and additional undeveloped sites, with a capacity of 10M tons per year and reserves of 462M tons. They’re not short on mines - they’re squeezing what they have.
A 52% jump in overburden removal costs. At one mine, they moved to a new area, and the cost per ton jumped from $0.21 to $7.03. Worth watching - if it’s a one-time cost of opening new ground, that’s fine. If not, it’s concerning.
SmartSystems11 isn’t growing. As I mentioned up top, SmartSystems is supposed to be the glue that keeps customers. But the numbers here don’t show new customer adoption. Customers aren’t leaving - but they’re not joining either. We’ll come back to this when we get to intangible assets.
Bottom line from this section: the company is relatively stable. There’s nothing that locks customers in, but overall, they’re steady.
Operating Lease Right-of-Use Assets - $23.5M vs. $23.2M last year Basically the same. Railcars and heavy equipment. Not interesting.
Intangible Assets - $4.3M vs. $5.1M last year This is what’s left from the acquisition of Quickthree Solutions - the company that sold them SmartSystems technology. The decline is normal amortization, and there’s no new investment. They’re not trying to save it. They’ll let it die quietly. Moving on.
Other Assets - $0.9M vs. $1.1M last year This amount is mainly legal costs incurred to set up a $30M credit facility they can draw on at any time, and the amortization of those costs. In other words, behind this line lies a strong point: they have immediate access to an additional $30M if needed.
The question that comes up: why create a line of credit in 2024 and not touch it? But given that they’re sitting on $22M in cash, maybe that’s exactly the point. They built a safety net they don’t need.
Asset summary
Total Assets - $340M vs. $341.5M last year Most of it is buried in land, mines, and equipment. Three questions remain open, and we’ll need to check in future reports: Where did the extra $12M in cash come from? Are the overburden costs at the new mine one-time? And why isn’t SmartSystems growing?
The book warns that the balance sheet is only part of the picture - a change in one report always affects the others. And at the end of all this, we’ll need to ask the real question: is their growth rate already priced in, or is there an opportunity here?
What do you owe?
This side of the balance sheet shows us something beyond just debts - it shows how the company financed its assets. Anything marked as Current needs to be paid within a year.
Current liabilities
Accounts Payable - $9.4M vs. $17M last year Down 45%. They’re paying suppliers faster. Good sign for liquidity ($22M cash), but it also means they’re not stretching suppliers’ credit as much as they used to.
Accrued Expenses - $17.5M vs. $12.6M last year Up 40%, mostly salaries and shipping costs not yet paid. Not worrying - it’s a sign they’ve been busier.
Deferred Revenue - $9.8M vs. $54K last year A massive jump. Customers paid in advance for a product that hasn’t shipped yet. That’s money already in the pocket, work still ahead. Very good sign.
Current Portion of Long-Term Debt - $4.4M vs. $3.6M last year The slice of long-term debt coming due this year. Small increase, not a concern.
Current Portion of Operating Leases - $8.8M vs. $10.1M last year Lease payments due this year - mainly railcars and heavy equipment. Small decrease, old contracts rolling off.
Long-term liabilities
Long-Term Debt - $8.7M vs. $9.1M last year Small decrease. Paying down debt, not taking on new debt.
Long-Term Operating Leases - $14.4M vs. $14.5M last year Basically the same. Old contracts rolling off, new ones being signed. Stable.
Deferred Tax Liabilities - $4.2M vs. $9.3M last year Down 55%. They owe less tax in the future. The question: how does that square with more orders? Probably because of the $9.8M in Deferred Revenue we saw - the company doesn’t recognize unshipped orders as income, so no tax is owed on them yet.
Asset Retirement Obligations - $22.5M vs. $21.3M last year A future obligation to restore the land. Not pressing now. Not pressing.
Other Liabilities - $0.7M vs. $0.3M last year Not interesting.
Interim summary
Total liabilities: $100M - up $2.5M from last year. But most of that increase comes from the $9.8M of product that customers already paid for but haven’t received yet. That’s not real debt, it’s work waiting to be done.
Let’s put it in perspective: out of $100M in liabilities, only $13M is actual financial debt. And they’re sitting on $22M in cash. They could cover all their real debt tomorrow morning and still have money left over.
What belongs to the shareholders?
What belongs to me. This is the section I always used to get confused by. The book helped me understand it like this: liabilities show what was financed with loans, equity shows what was financed by investors, and what the company generated on its own. One of a company’s goals is to increase equity. So let’s check - did SND pull it off?
Common Stock - $39K (par value only)12
Treasury Stock - ($17.4M) vs. ($14.7M) last year The company bought back 8.86M of its own shares over the years at an average price of $1.96 per share. The Stock trades today at $3.86. They bought themselves at half price.
And following up on the company issuing 1.16M shares to employees, what we get at the end of the day is: motivated employees, fewer shares on the open market, and the company keeps buying more. They approved an additional $20M buyback program.
When the CEO holds 18% of the shares, every buyback increases the value of his stake. They have a personal incentive to buy.
Additional Paid-In Capital - $189M vs. $185M last year When an investor bought a share at $11, and the par value is $0.001, they record the $10.999 here. This is the money investors brought from home.
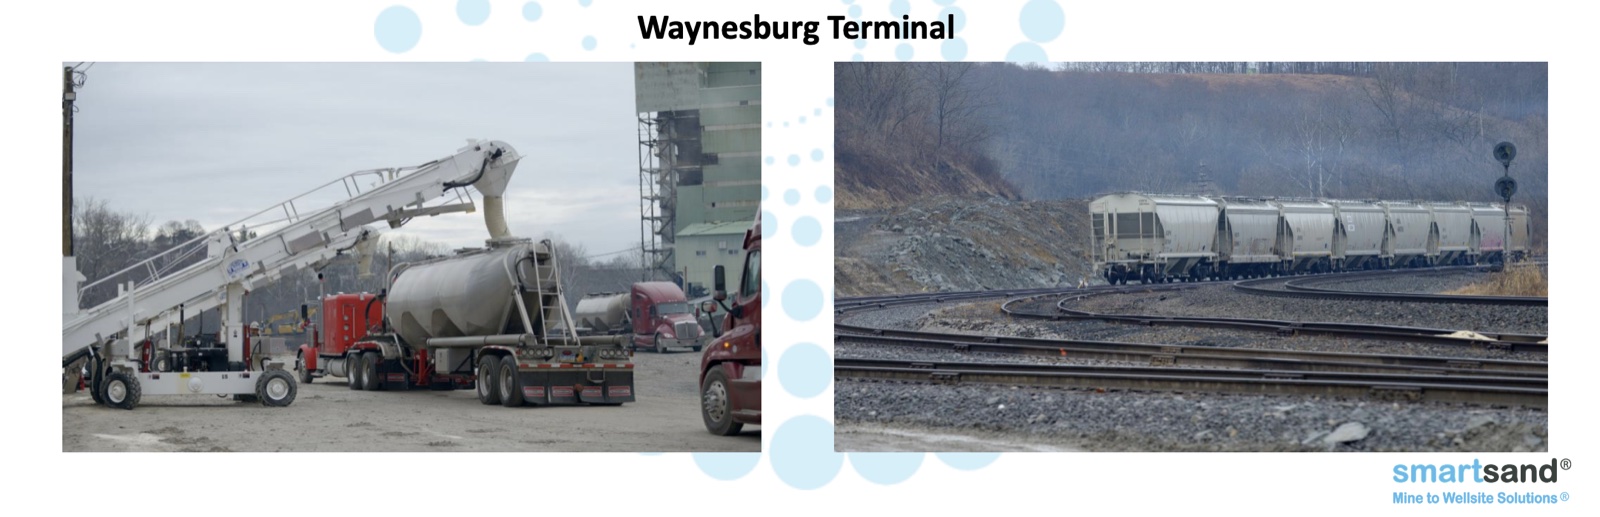
What did they do with it? Three active mines, seven terminals, access to four rail lines, and 10M tons of processing capacity per year.
Retained Earnings - $68M vs. $73M last year All the profits the company has accumulated since its founding, minus dividends paid out. This year, they distributed $6.5M, which is why the number went down. Noteworthy: $68M in retained earnings versus $189M that came from investors. Most of the equity was built on money brought in from investors, not on profits the company generated itself.
Accumulated Other Comprehensive Loss - ($53K) vs. ($60K) last year Adjustments outside the company’s control. Pensions, unrealized investments. Negligible.
Total Shareholders’ Equity - $239.7M vs. $243.8M last year What belongs to the shareholders on the books. Small decrease, mainly due to the dividend paid out.
The company’s market cap: $174M. Book equity: $240M. The market is pricing the company below its paper value. We’ll come back to this in the summary.
Total Liabilities and Shareholders’ Equity - $340M The balance sheet balances. $100M liabilities plus $240M equity = $340M in assets. Exactly as it should.
So, why does this interest me as an investor?
Three things jump out from this balance sheet:
Forward contracts. $205M for 2026 and another $70.6M for 2027. Customers already paid some of that money in advance, as we saw in Deferred Revenue.
The CEO has serious skin in the game. He holds 18% of the shares. Every buyback increases the value of his stake. I wonder if they’ll buy at the current price.
What’s yours as an investor. $240M in equity, divided by 38.9M shares = $6.15 per share. The Stock trades at $3.86. You’re buying $6.15 of book value for $3.86. That’s 0.63x book value.
Mission summary
I used both the book and Claude. No apologies.
5 hours, three things at once: I read a book about how to read financial statements (I even wrote this post to make sure the knowledge sticks.
Reading is a dialogue. This post is the proof.
Footnotes
-
Financial Intelligence (Revised Edition): A Manager’s Guide to Knowing What the Numbers Really Mean. ↩
-
The balance sheet is one of three core financial statements every public company publishes. The other two: the income statement (how much you earned from an accounting perspective) and the cash flow statement (how much actual cash came in and went out). We’ll get to those in future posts. ↩
-
Ticker: SND ↩
-
Coarse sand that’s packed into rock fractures to hold them open and let oil or gas flow out. ↩
-
Answering this takes two separate reports, because there are two ways to define “profit.” The income statement measures accounting profit - Revenue minus expenses on paper. The cash flow statement measures actual cash inflows and outflows. A company can show a beautiful profit on the income statement while simultaneously heading for bankruptcy because it has no cash. We’ll cover both in future posts. ↩
-
See footnote 2. ↩
-
Found on page 76 of their annual report. ↩
-
Before we dive in, it’s important to understand how the balance sheet is organized: top to bottom by speed. On the asset side, what can be converted to cash fastest comes first. On the liability side, what needs to be paid soonest comes first. This isn’t random - it helps us gauge the company’s liquidity at a glance. ↩
-
Inventory consists of four types: raw materials, sand in processing, finished product, and spare parts. Cost is calculated on an average per-ton basis. Because you can’t count sand like boxes in a warehouse, they use a yield adjustment - a safety margin that accounts for density and moisture variations. ↩
-
They improved their processing plants and transload terminals - more control over the supply chain. There’s also a small increase in real estate, probably additional offices in Pennsylvania. ↩
-
A smart sand storage system is installed directly at the well site. Saves the customer trucks and simplifies logistics. ↩
-
Par value is a symbolic number set when the company was founded. In SND’s case, one-tenth of a cent per share. It has no real economic meaning. ↩