From 1,227 city leads to 30 laser-targeted Texas counties
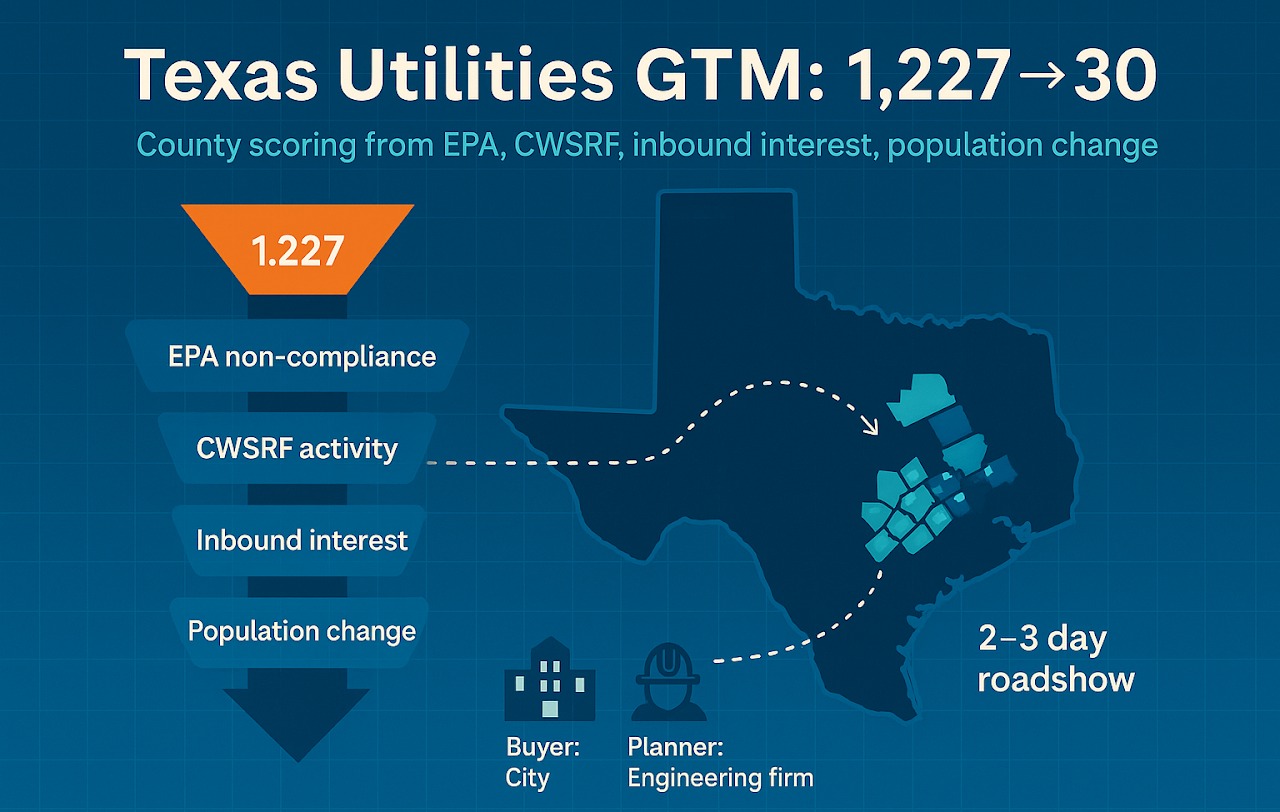
Built a county-level targeting model blending EPA non-compliance, CWSRF activity, inbound interest, and population change to focus a Texas utilities roadshow.
TL;DR
- I started with 1,227 “hot” municipal leads.
- I built a county-level model that blends EPA non-compliance, CWSRF activity, inbound interest, and population change.
- The output is a ranked list of about 30 Texas counties to anchor a 2 to 3 day roadshow with partner outreach.
Why this project
Moving from classic “tech” sales into utilities tech forces you to slow down. In utilities, you do not sell to one account. You sell into a small ecosystem:
- Buyer: the city or utility district
- Planner: the engineering firm that scopes and stamps projects
- Legislator and regulator: the folks who approve, fund, or block
My job was to turn an EPA list into meetings. After about 6 weeks, I had mixed results. Some cities engaged. Others did not.
Problem
When I planned a small roadshow for the AE after a conference, I saw how far apart the cities were and calculated how much time and money we would spend for very few meetings. This showed me I needed a better targeting approach than the EPA list.
Discovery
The key question was: where should we focus in Texas to plan a roadshow?
Data sources:
- EPA Lagoon Inventory (2023): non-compliant lagoon flags per city
- CWSRF: Clean Water State Revolving Fund activity signals
- HubSpot interest log: cities that showed inbound interest (not shown here)
- Population growth by city: Wikipedia scrape to create a simple growth score
- City-to-County map: to roll signals up to the county level
Steps taken
- Filter cities to the ICP window we had set.
- Aggregate by county, count ICP-fit cities, then pull the top 10.
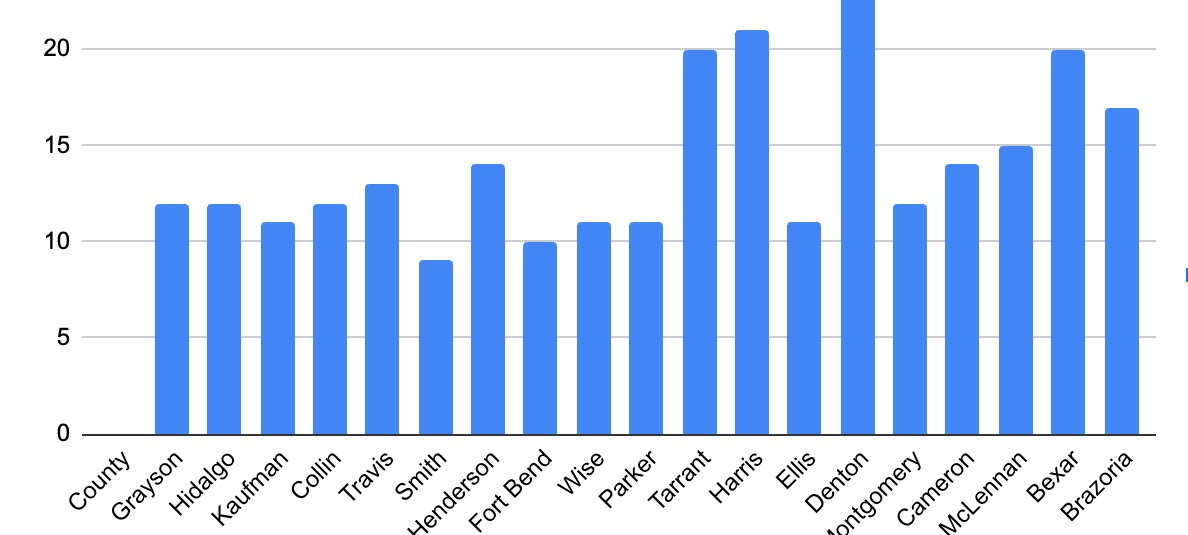
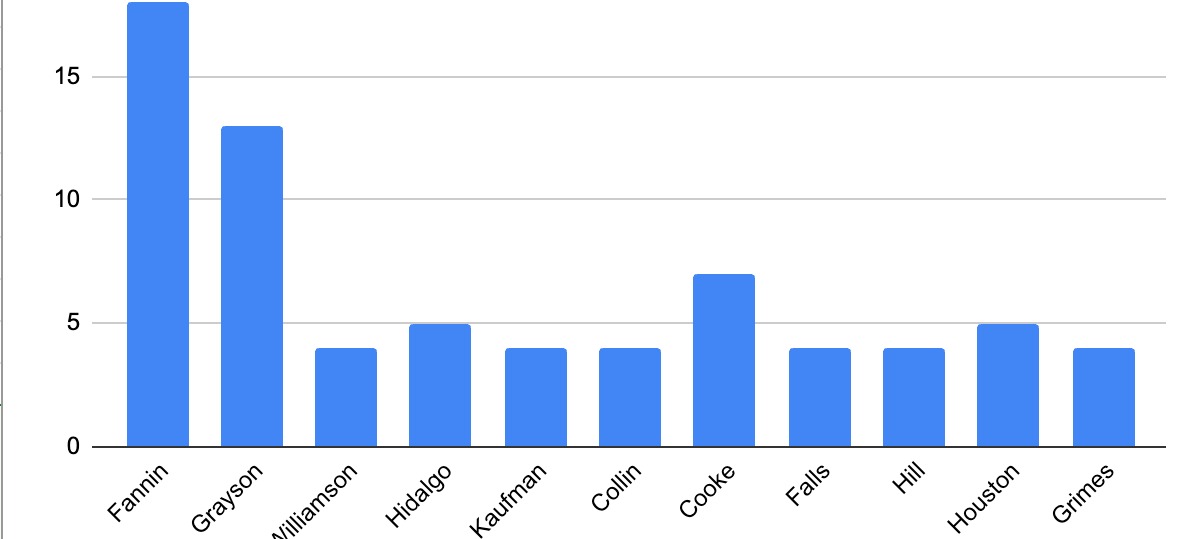
- Connect EPA and CWSRF data to the cities database, then find the top counties.
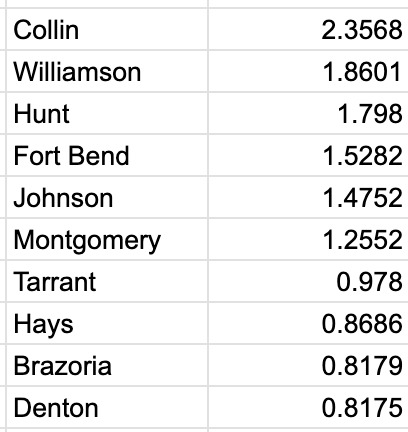
- Based on conversations with our Engineering team, we know that cities with the most significant population growth or decline will need our solution, so we know where it happens.
Col1 = County
Col2 = Population Change Metric
Col3 = City population

=QUERY(
  {D2:D, O2:O, F2:F},
  "select Col1, max(Col2)
   where Col2 is not null
     and Col3 >= 500
     and Col3 <= 100000
   group by Col1
   order by max(Col2) desc
   limit 10",
  0
)
- To see which counties face current challenges, based on city interest.
Results
- Stakeholder alignment: a shift from “Texas” to specific counties.
- Sales ops impact: created a repeatable template. When new data lands, we drop it in, and the model updates.
- Produced a target list of counties with city shortlists for roadshow planning.
- Shortlisted engineering firms per target county for partner outreach.
- A way of targeting that we can duplicate in different states.
The big result
We were able to define our TAM, SAM, and SOM for the first time. More importantly, we built the infrastructure to forecast when a city will need us and when to approach our ICP, saving resources.