The 1 field that exposed 20% no-shows and a 2-week reschedule lag
Added one date field that exposed a hidden no-show rate and a two-week reschedule lag, aligning SDR and sales on a shared KPI.
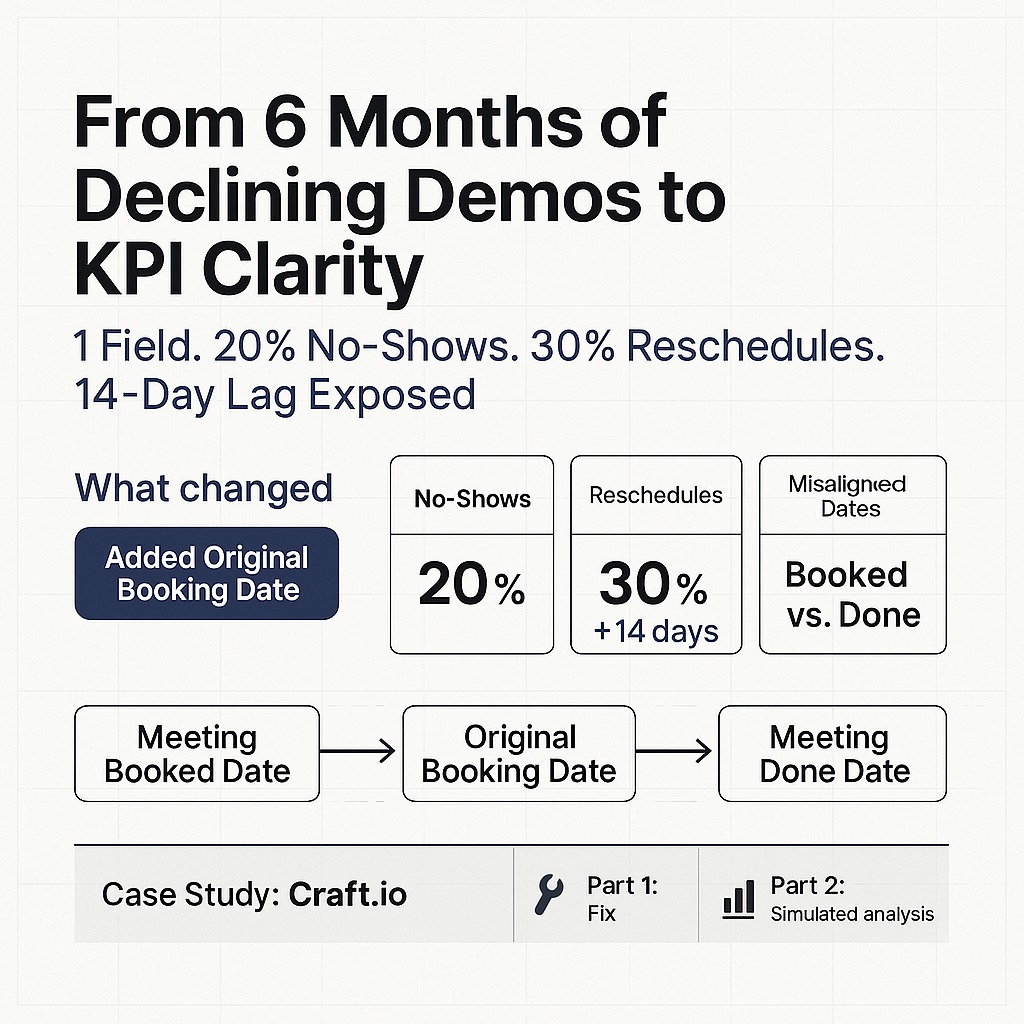
This case study has two parts: what I found at Craft.io and the fix I shipped, then a simulated analysis on AI-generated data that walks through the methodology in SQL.
TL;DR
- Found a tracking gap: SDRs and sales were measuring different dates.
- Reality: about 30% of meetings were rescheduled by around 2 weeks, extending the sales cycle, and a 20% no-show rate.
- Simple solution: one date field, “Original Booking Date,” to track when a meeting was first booked.
Context
At Craft.io, the sales team reported a decline in meetings, and the quick fix suggested was to update the outbound sequence. I wanted to investigate the underlying cause, and what I found was:
- The SDR (me) was tracking meetings using “Meeting Booked Date,” the day I scheduled the meeting.
- The sales team was tracking meetings using “Meeting Done Date,” when the demo actually occurred.
This created three predictable problems:
- If I booked for next month, I counted it now, they counted it next month.
- If a demo got rescheduled, it created a gap between the booked and held dates.
- If a demo was canceled or a no-show, it stayed on my meeting list but was not reported anywhere.
Over a few months, this led to a compounded data misalignment.
Part 1: the solution
I created a third date field, “Original Booking Date,” to capture the exact date I first scheduled the meeting.
With all three fields in place, we could now track:
- How many meetings I booked each month vs. when they actually occurred
- Whether meetings happened on the originally scheduled date
- How far out rescheduled meetings were being pushed
What the data revealed:
- ~20% no-show rate that wasn’t visible in either system
- ~30% reschedule rate with an average delay of 2+ weeks
- The issue labeled “decline” was not the pipeline itself, but a scheduling friction problem
The impact:
- Sales, marketing, and SDR teams are now aligned on the same KPIs
- We could proactively address no-shows and reschedules
- Leadership had visibility into the actual length of the sales cycle
Part 2: simulated analysis (the original investigation, recreated)
Using a prompt I wrote, I generated a dataset to simulate the process, then ran the analysis in BigQuery.
The prompt:
Create a CSV with 1,200 rows that simulates CRM demo status.

Fields:
- meeting_id
- account_id
- ae_owner: Alex or Moti
- marketing_source: Outbound; Inbound; Partner; Event; Referral
- contact_channel: Email; Phone; LinkedIn
- meeting_booked_date: ISO 8601 YYYY-MM-DD
- original_booking_date: ISO 8601 YYYY-MM-DD
- meeting_done_date: ISO 8601 YYYY-MM-DD or blank if not held

Constraints:
- Dates span the last 26 weeks.
- Sources: Outbound, Inbound, Partner, Event.
- Two owners with roughly even distribution.

Output:
- Clean CSV, no commentary, ISO date format YYYY-MM-DD.
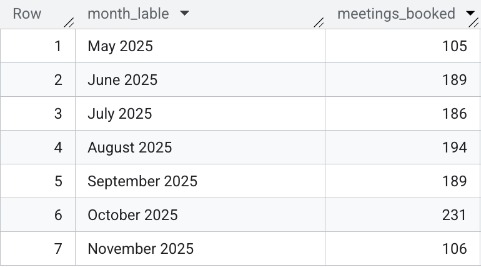
1. Meetings booked per month
WITH by_month AS (
  SELECT
    DATE_TRUNC(meeting_booked_date, MONTH) AS month,
    FORMAT_DATE('%B %Y', DATE_TRUNC(meeting_booked_date, MONTH)) AS month_label,
    COUNT(*) AS meetings_booked
  FROM `craft-io-crm-analysis.craft_io_demo_data.meetings`
  WHERE meeting_booked_date IS NOT NULL
  GROUP BY month, month_label
)
SELECT month_label, meetings_booked
FROM by_month
ORDER BY month;
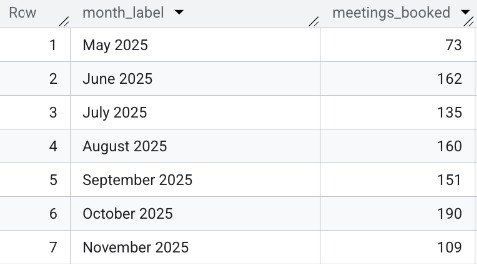
2. Meetings held per month
WITH by_month AS (
  SELECT
    DATE_TRUNC(meeting_done_date, MONTH) AS month,
    FORMAT_DATE('%B %Y', DATE_TRUNC(meeting_done_date, MONTH)) AS month_label,
    COUNT(*) AS meetings_booked
  FROM `craft-io-crm-analysis.craft_io_demo_data.meetings`
  WHERE meeting_done_date IS NOT NULL
  GROUP BY month, month_label
)
SELECT month_label, meetings_booked
FROM by_month
ORDER BY month;
3. No-show rate

SELECT
  COUNTIF(meeting_done_date IS NULL
    AND original_booking_date < DATE_SUB(CURRENT_DATE(), INTERVAL 7 DAY)) AS no_shows,
  SAFE_DIVIDE(
    COUNTIF(meeting_done_date IS NULL
      AND original_booking_date < DATE_SUB(CURRENT_DATE(), INTERVAL 7 DAY)),
    COUNT(*)) AS no_show_rate
FROM `craft-io-crm-analysis.craft_io_demo_data.meetings`
WHERE original_booking_date IS NOT NULL;
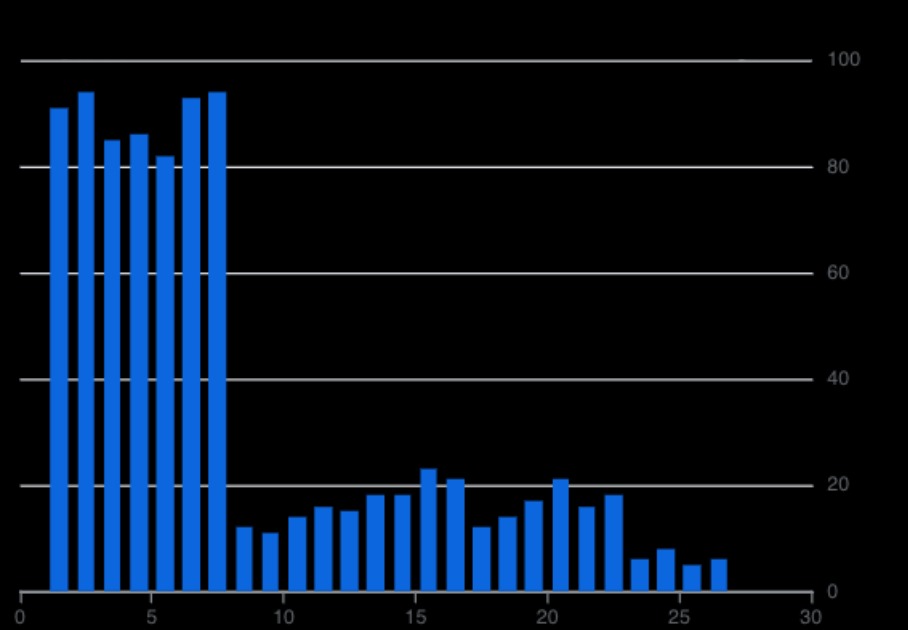
4. Reschedule rate
WITH base AS (
  SELECT
    meeting_id,
    original_booking_date,
    meeting_done_date,
    DATE_DIFF(meeting_done_date, original_booking_date, DAY) AS reschedule_days
  FROM `craft-io-crm-analysis.craft_io_demo_data.meetings`
  WHERE meeting_done_date IS NOT NULL
    AND original_booking_date IS NOT NULL
    AND meeting_done_date <> original_booking_date
)
SELECT base.reschedule_days, COUNT(*) AS meeting_moved
FROM base
GROUP BY base.reschedule_days
ORDER BY base.reschedule_days;
5. Average reschedule delay (in days)
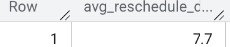
WITH resched AS (
  SELECT
    meeting_id,
    original_booking_date,
    meeting_done_date,
    DATE_DIFF(meeting_done_date, original_booking_date, DAY) AS reschedule_days
  FROM `craft-io-crm-analysis.craft_io_demo_data.meetings`
  WHERE meeting_done_date IS NOT NULL
    AND original_booking_date IS NOT NULL
    AND meeting_done_date <> original_booking_date
)
SELECT ROUND(AVG(resched.reschedule_days), 1) AS avg_reschedule_days
FROM resched;
The takeaway from the generated data
The numbers tell the story:
- 212 no-shows (18%) that weren’t visible in either system
- 829 rescheduled meetings that created timing gaps between booking and execution
- Rescheduling clustered heavily in the 1 to 7 day range (89% of reschedules), with a long tail extending 3+ weeks out
One field. 18% no-shows exposed. 829 reschedules tracked. Zero guesswork.